



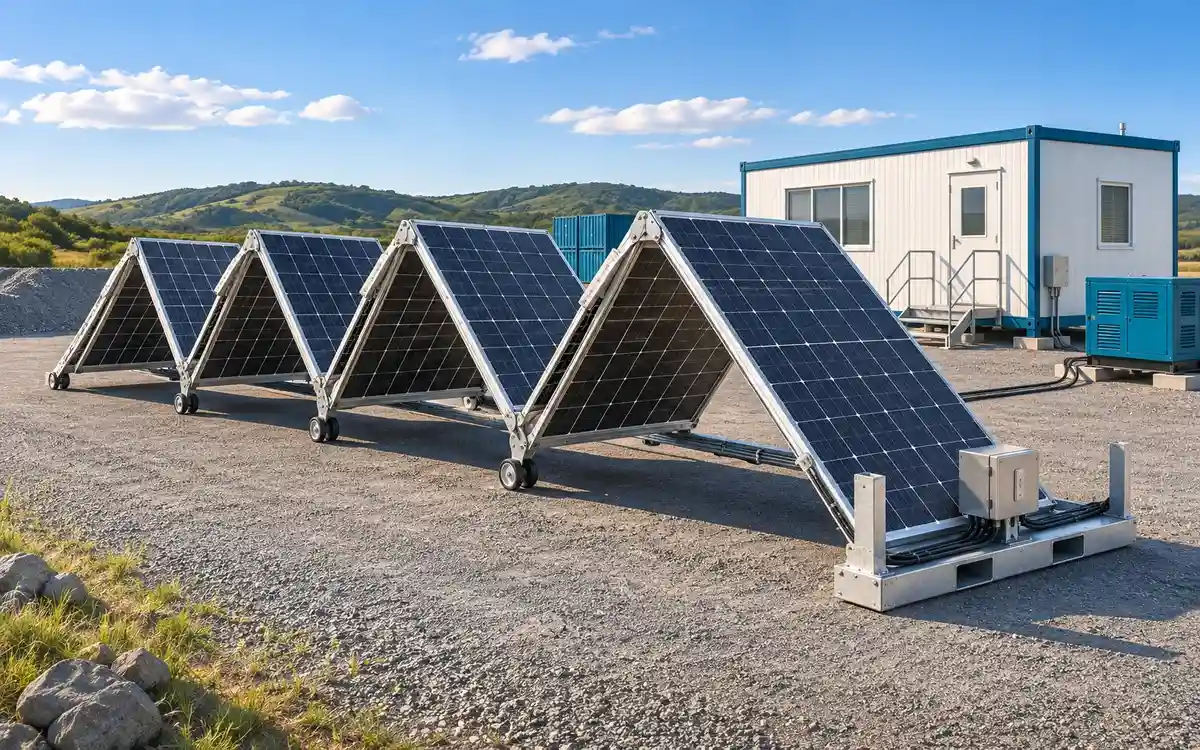
Conceptual application illustration. Equipment layout and the electrical package follow the selected model and project design.
A mobile solar array's kilowatt rating is the starting point for an energy estimate. The electricity it produces over a day depends on the sunlight reaching the deployed modules, the electrical conversion equipment and the hours the array is actually available. That distinction matters when planning temporary construction power, remote field camps or a short emergency deployment.
The mobile fold-out solar array system page lists PowerFold-GL144 as 36 × 400 W modules and PowerFold-GL288 as 72 × 400 W modules. Use those actual DC ratings for a proposal; the 15 kW and 30 kW figures below are comparison sizes, not replacement product specifications.
kW, kWh and Battery Capacity: Four Numbers to Keep Separate
PV capacity, in kW DC, is the combined module nameplate power under standard test conditions. It does not describe a constant output throughout daylight hours, nor does it set the AC inverter's continuous rating.
Daily generation, in kWh/day, measures energy accumulated over time. A 2 kW load operating for eight hours uses 16 kWh; the same load operating continuously for 24 hours uses 48 kWh.
Battery energy, in kWh, describes storage capacity. Usable energy depends on the selected battery's operating limits, reserve setting and discharge losses. Storage-unit power, in kW, is a separate rating that affects charge or discharge capability. Check its precise meaning in the selected unit's datasheet.
For example, the GL144 reference array is 14.4 kW DC, while its listed optional storage package is 12 kW / 32 kWh. A 32 kWh battery is not a daily solar-generation rating. The DOE solar and storage overview explains why storage power and stored energy are different quantities.
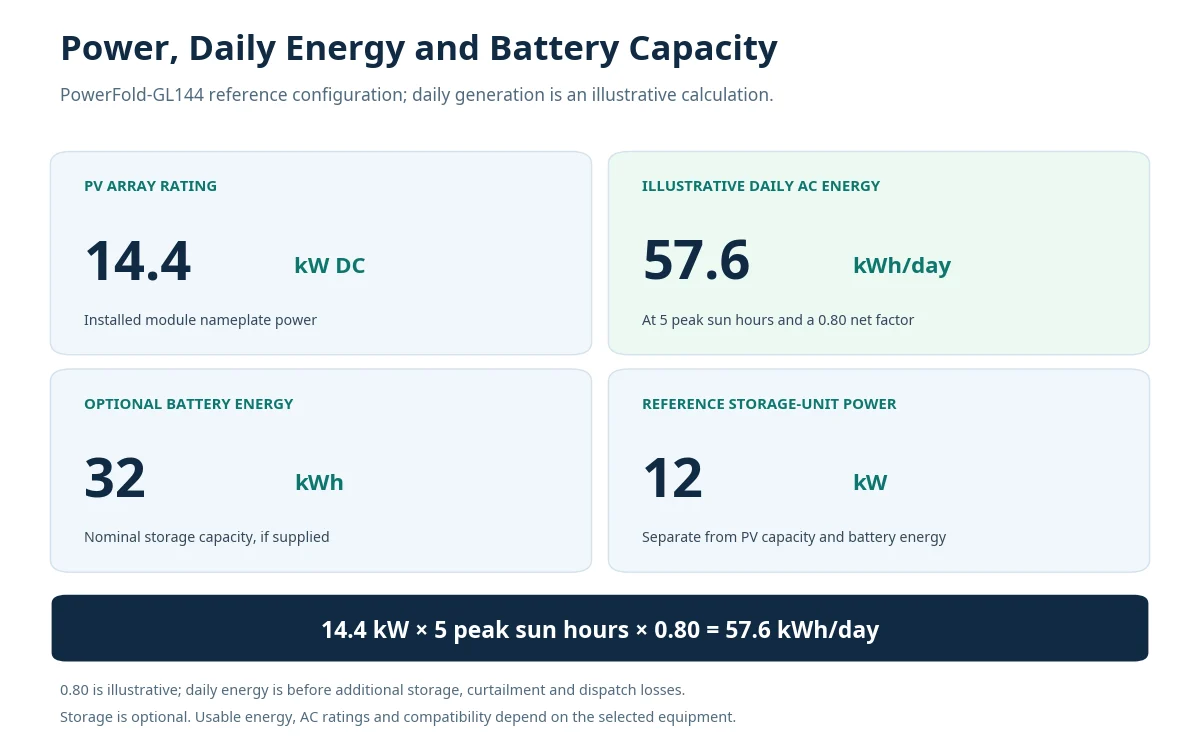
The 57.6 kWh/day figure is a worked example. The 12 kW / 32 kWh storage option is separate and optional; final ratings follow the quoted equipment.
How to Calculate Daily Mobile Solar Energy Output
For an initial comparison, use:
Illustrative daily AC energy ≈ array DC capacity × equivalent peak sun hours × net yield factor
In this article, the net factor is 0.80. It is an assumed combined allowance for PV and conversion effects such as operating temperature, soiling, wiring and inverter losses. It is not a measured Hinergy efficiency, a minimum performance ratio or a universal PVWatts/PVGIS default.
The estimate represents potential energy at a hypothetical, suitably sized conversion stage's AC output, before additional battery-path losses, unaccepted surplus or project dispatch restrictions. If the receiving equipment cannot accept the array's output, the estimate must be revised. A DC-only charging design needs an estimate at its actual measurement boundary.
Peak sun hours are different from daylight hours
Five peak sun hours represent the equivalent daily solar energy of five hours at 1 kW/m² on the module plane. They do not mean that a panel delivers full rated power for every hour between sunrise and sunset. The DOE solar-radiation guide describes how location, season, weather and time of day change the available resource.
Use irradiation for the approved deployed orientation. If sections face different directions or have different slopes, model those groups separately rather than assigning every module the same ideal exposure.
Avoid double-counting losses: a location-specific AC yield already expressed as kWh per installed kW per day can be multiplied directly by array capacity. Do not treat that finished yield as raw peak sun hours and automatically multiply it by 0.80 again. Keep the measurement boundary consistent.
Daily Energy Examples for 15 kW, 30 kW and Hinergy Configurations
The table uses the same 0.80 illustrative net factor throughout. The 3–6-hour inputs are scenarios, not measured weather data, minimum output levels or an upper limit on possible production.
Equivalent peak sun hours/day | 15 kW comparison array | 30 kW comparison array | GL144: 14.4 kW DC | GL288: 28.8 kW DC |
|---|---|---|---|---|
3 | 36.0 kWh/day | 72.0 kWh/day | 34.6 kWh/day | 69.1 kWh/day |
4 | 48.0 kWh/day | 96.0 kWh/day | 46.1 kWh/day | 92.2 kWh/day |
5 | 60.0 kWh/day | 120.0 kWh/day | 57.6 kWh/day | 115.2 kWh/day |
6 | 72.0 kWh/day | 144.0 kWh/day | 69.1 kWh/day | 138.2 kWh/day |
Worked example: 14.4 kW × 5 hours × 0.80 = 57.6 kWh/day. Doubling the DC capacity to 28.8 kW gives 115.2 kWh/day under identical assumptions.
In this linear example, the 14.4/28.8 kW configurations produce 4% less than the 15/30 kW comparison sizes because their DC capacities are 4% smaller. Actual installations may differ because of layout, shading and conversion limits.
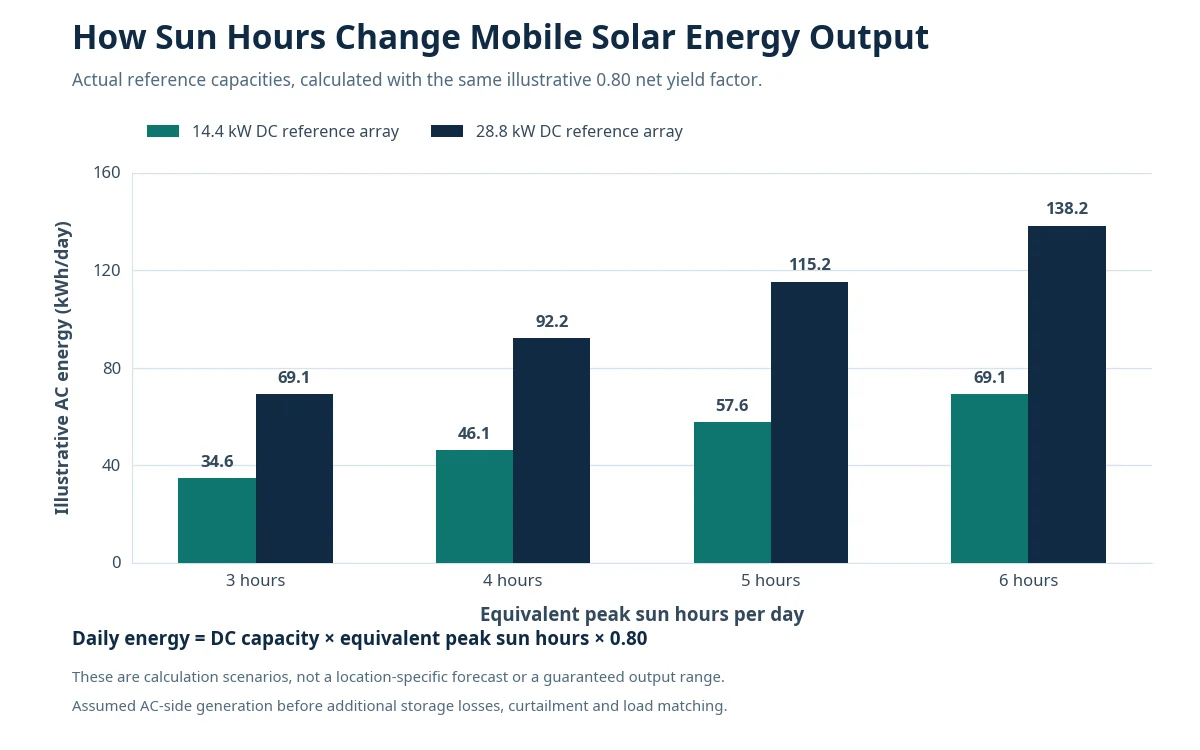
Illustrative AC-side generation before additional storage or dispatch losses. Site-specific results require the actual location, season, deployed layout and receiving equipment.
Monthly and Annual Output Need the Right Operating Calendar
For a simple project-duration example, 20 fully available days at the GL144's 57.6 kWh/day scenario give 1,152 kWh. Thirty identical days give 1,728 kWh. Both calculations assume the same daily sunlight and loss conditions; they are not predictions for a particular calendar month.
For an annual mobile solar energy estimate, use monthly or hourly weather-based results and the actual deployment schedule. Include periods when the equipment is stowed, moving, disconnected or restricted by site operations. One sunny day's output multiplied by 365 is a constant-condition illustration, not a year-round operating forecast.
Check the planned operating season separately. An annual average can conceal the winter or wet-season shortfall that determines battery reserve and backup requirements at a remote site.
What Changes Output at a Temporary or Remote Site?
Location, season and weather
A transportable solar array moved between sites does not carry its original solar resource with it. Recalculate for the destination and operating month, including cloudy periods. Output can fall below every scenario in the table; stowed, disconnected or fully covered equipment contributes no usable project generation.
Deployed geometry and shading
Use the selected model's approved layout and actual module-bank orientations. Nearby cabins, fencing, vehicles and adjacent array sections can shade modules at particular times. Do not assume a temporary ground-deployed array performs like an optimally oriented, unshaded rooftop system.
Time available in the sun
Arrival after midday, delayed electrical handover or early recovery can remove valuable generating hours. For a first-day deployment estimate, use the solar resource during the actual operating window. Do not apply a whole-day result to a partly deployed day. The deployment and stowage guide covers the associated site-planning tasks.
Receiving equipment and curtailment
PV-input voltage, current and MPPT limits, conversion power and the control mode can restrict captured energy. A full battery, low daytime demand or an export restriction can leave some available generation unused. A larger array therefore needs a compatible electrical and operational design, not just a larger nameplate number.
Can the Array Cover Your Load and Charge a Battery?
Compare generation with a time-based load schedule. A continuous 2 kW service load requires 48 kWh/day. In the four-sun-hour example, GL144 calculates to about 46.1 kWh/day before additional storage losses or unused surplus, so that scenario already falls short of the load's daily energy requirement. The five-hour result of 57.6 kWh/day is higher, but it does not prove uninterrupted operation through the night or a cloudy spell.
You must also check simultaneous AC demand, starting currents, inverter output, overnight reserve and how the battery is recharged while daytime loads are running. The construction-site solar sizing guide explains how to prepare that load brief.
A battery shifts some captured energy to another time and introduces charging/discharging losses. Its usable capacity, charge acceptance, reserve level and control strategy affect the result. Use the fold-out array and BESS integration guide for receiver-specific checks. Array supply, battery storage and power conversion should be identified separately in the quotation.
Build a Site-Specific Energy Estimate
Give the project designer a consistent set of inputs:
Location and operating dates: coordinates, season, planned site duration and relocation windows.
Actual PV configuration: module quantity, DC rating, deployed drawings, slopes, azimuths and shading information.
Operating availability: expected handover time, daily deployed hours, restrictions and planned downtime.
Electrical equipment: designated PV-input limits, MPPT arrangements, conversion ratings and any existing BESS or generator.
Load profile: hourly demand where possible, daily kWh, simultaneous peaks, starting loads and overnight priorities.
Storage and backup scope: nominal and usable battery energy, charge/discharge power, reserve policy and backup availability.
PVWatts provides a starting point for weather-based, grid-connected PV generation estimates, including monthly and hourly AC results. Its output is not an off-grid autonomy assessment. PVGIS offers solar-resource and PV modelling tools, including an off-grid option; its inputs and assumptions still need to match the proposed equipment and load. The PVGIS user manual explains those boundaries.
For a mobile system, combine generation modelling with hourly load and storage analysis and the real deployment calendar. Review remote-site and field-camp planning where fuel logistics, operating season and overnight services drive the power brief.
Frequently Asked Questions
How many kWh does a 15 kW solar system produce per day?
How much electricity can a 30 kW mobile solar array generate daily?
Does a 30 kW array always produce twice as much as a 15 kW array?
Can a mobile solar array supply electricity at night?
What peak sun hours should I use for winter or a cloudy location?
Is a 32 kWh battery enough for a 14.4 kW array?
Are the figures in this article measured Hinergy production results?
Sources and Calculation Basis
Hinergy: Mobile Fold-Out Solar Array System — reference module counts, PV capacities and optional storage packages.
PVWatts official calculator — grid-connected PV estimation inputs, AC results and interpretation cautions.
European Commission JRC: PVGIS 5 user manual — resource data, system geometry and modelling options.
U.S. DOE: Solar Radiation Basics — location, season and weather effects.
U.S. DOE: Solar Energy and Storage Basics — storage energy, power and losses.
Calculation basis: E ≈ P × H × 0.80; values rounded to one decimal where appropriate. The 0.80 factor is illustrative. No location-specific simulation or field measurement is presented in this article.